Downtime Should Be in the Earnings Model
At a 40% contribution margin and 15x multiple, roughly 33 basis points of recovered output supports $1 billion of incremental enterprise value for a $50 billion manufacturer. The hurdle for financial materiality is lower than most investors assume.

For asset-intensive companies, small improvements in manufacturing availability can create material earnings and enterprise value. Investors rarely quantify the opportunity.
Public-market investors spend considerable time underwriting relatively small changes in operating performance. A 50-basis-point improvement in gross margin matters. So does a reduction in SG&A, better working-capital turns, a procurement program or a restructuring initiative.
Manufacturing availability deserves the same treatment.
Unplanned manufacturing downtime reduces output from assets on which the capital has already been spent. Depending on the cause and the industry, the financial impact can include lost production, lower fixed-cost absorption, overtime, scrap, expedited maintenance, and delayed customer shipments.
Yet downtime is rarely discussed externally as an earnings variable. That is partly understandable. Companies do not report it consistently, the economics differ substantially by industry, and not every hour of downtime translates directly into lost revenue. But that does not make the variable immaterial.
The more useful question for an investor is:
How much improvement in manufacturing performance would be required to produce a meaningful change in enterprise value?
The hurdle may be lower than it appears.
Start with the valuation, not the downtime estimate
Consider a hypothetical global manufacturer generating $50 billion of annual revenue.
Suppose the objective is to identify enough recurring operating improvement to support $1 billion of incremental enterprise value. At a 15x multiple on incremental operating earnings, the company would need approximately $67 million of sustainable incremental annual operating profit. If incremental production carries a 40% contribution margin, generating that $67 million would require approximately $167 million of additional economic output. Against a $50 billion revenue base, that represents 33 basis points of annual revenue.
| Illustrative value bridge | Amount |
| Revenue | $50.0B |
| Target incremental enterprise value | $1.0B |
| Illustrative earnings multiple | 15.0x |
| Required incremental operating profit | $66.7M |
| Illustrative contribution margin | 40% |
| Required recovered production value | $166.7M |
| Required recovered production / revenue | 33 bps |
These figures are illustrative. They are not estimates for any particular company.
But they establish the relevant hurdle. For a $50 billion manufacturer, the question is not whether eliminating downtime could somehow produce another $1 billion of annual revenue. It is whether improvements in availability and operational execution could recover economic output equivalent to approximately 33 basis points of sales.
That is a more useful underwriting question. And the conclusion is not especially dependent on one assumption.
| Incremental contribution margin | 10x multiple | 15x multiple | 20x multiple |
| 25% | 80 bps | 53 bps | 40 bps |
| 40% | 50 bps | 33 bps | 25 bps |
| 60% | 33 bps | 22 bps | 17 bps |
Basis points of recovered revenue required to support $1 billion of incremental enterprise value for a $50 billion-revenue company.
The assumptions matter. But across a fairly wide range of them, the threshold for financial materiality remains relatively small.
A public-company example: Eli Lilly
Eli Lilly provides a useful case study because the financial inputs are public and the value of manufacturing capacity is clearly visible in its capital-allocation decisions.
This is not an estimate of Lilly’s downtime, nor an assertion that Lilly has an unusual downtime problem. There is insufficient public information to make either claim.
Instead, Lilly allows us to ask a narrower question:
What could relatively small improvements in manufacturing availability be worth at a company where incremental production capacity is already demonstrably valuable?
Lilly generated approximately $65.2 billion of revenue in 2025, an increase of 45% from the prior year. The company spent approximately $7.8 billion on capital expenditures during the year and said it was expanding manufacturing capacity to meet existing and expected demand for its medicines. [1]
The capital deployment has continued. In May 2026, Lilly announced another $4.5 billion of investment across two Indiana manufacturing sites, bringing its manufacturing capital commitments in Indiana since 2020 to more than $21 billion. Lilly explicitly cited its evolving pipeline and anticipated medicine demand as drivers of the investment. [2]
That establishes an important fact for an investor:
Incremental manufacturing capacity has economic value to Lilly.
The next question is what marginal improvements in the availability of the capacity already installed might be worth.
What are 10 basis points worth?
On $65.2 billion of annual revenue, 10 basis points represents approximately $65 million of incremental output.
Lilly reported approximately $11.1 billion of cost of sales against $65.2 billion of 2025 revenue, implying a very high reported gross margin. [1] It would be inappropriate to assume that gross margin translates directly into the incremental contribution margin on recovered production. Product mix, royalties, manufacturing costs, and other expenses all matter.
So assume, for illustration, a substantially lower 60% incremental contribution margin.
| Illustrative Lilly sensitivity | Amount |
| 2025 revenue | $65.2B |
| Recovered output | 10 bps |
| Incremental revenue | $65M |
| Illustrative incremental contribution margin | 60% |
| Incremental operating profit | $39M |
| Illustrative earnings multiple | 20x |
| Implied incremental enterprise value | ~$780M |
Under the same assumptions, approximately 13 basis points of recovered output would support roughly $1 billion of incremental enterprise value.
Again, this is not an estimate of Lilly’s recoverable downtime. It is a sensitivity analysis. We do not need to know whether Lilly has 5, 50, or 500 basis points of economically recoverable downtime to make the analysis useful. We only need to establish the threshold at which an improvement becomes financially material.
At Lilly’s scale, that threshold is low.
Compare recovered capacity with purchased capacity
This is where the issue becomes a capital-allocation question.
Lilly spent $7.8 billion on capital expenditures in 2025 and expects capital expenditures to remain meaningfully elevated as it expands its global manufacturing network. [1]
Those investments may generate exceptional returns. Strong demand may require Lilly to simultaneously build new capacity and improve the productivity of the existing asset base. The two are not mutually exclusive. But finance should compare them.
Suppose management can spend $500 million to create a given amount of new production capacity.
Now suppose a combination of reliability improvements, process changes, better maintenance, improved response procedures, and operational technology can create a smaller amount of effective capacity from existing facilities for $10 million.
The appropriate comparison is not the absolute amount of output. It is the incremental return on invested capital. For every dollar invested: How much sustainable incremental operating profit is created?
That makes recovered capacity economically comparable with purchased capacity. And where existing facilities are already built, staffed, and supplied, the economics can be particularly attractive because much of the fixed capital is already on the balance sheet.
Effective capacity is not the same as installed capacity
Investors often treat manufacturing capacity as something close to a static figure. A company has installed capacity of X units and is operating at Y utilization.
In practice, effective capacity is a function of several variables:
Installed capacity × availability × utilization × yield
Two companies can own identical production assets but generate very different economic output from them. A facility with lower equipment availability requires more installed capacity to produce the same output.
Conversely, improving availability can function economically like adding capacity—without necessarily requiring the capital expenditure associated with constructing new facilities or production lines.
That distinction becomes particularly important when demand is strong enough that production capacity is constraining revenue growth. In those situations, a basis point of availability is not simply an engineering statistic. It can have a measurable value.
Downtime is several different problems
It is useful to separate unplanned downtime into different categories.
Some failures can be prevented. Some cannot. Some can be predicted. Some occur with little warning.
Once an abnormal condition occurs, however, the duration of the resulting interruption depends partly on how quickly the organization recognizes, communicates, and responds to it.
That creates at least two distinct opportunities. Failure prevention reduces the number of incidents. Failure response reduces the duration and severity of incidents once they occur.
Most discussion around industrial digitization has focused on the first category: sensors, predictive maintenance, machine learning, and condition monitoring. The second category receives less attention.
Yet the economic relationship is straightforward:
Total economic downtime = incident frequency × average duration × economic cost per unit of time
A manufacturer can therefore improve the result by reducing incident frequency, reducing average duration, reducing economic severity, or some combination of the three.
This distinction matters because reducing response time may require substantially less capital than preventing the underlying failure.
Detection and response are different variables
Modern industrial facilities produce enormous amounts of operational information. PLCs, SCADA systems, HMIs, and other control infrastructure continuously monitor machinery and production processes.
A critical operating condition may therefore be detected immediately.
But detection is not intervention. The condition must be identified as requiring action. The appropriate person must be notified. That person must acknowledge the event. Responsibility may need to escalate if no action occurs. Someone must intervene. Production must return to normal operation. Each interval can be measured. Each has potential economic value.
Suppose a production interruption has a contribution impact of $100,000 per hour. Reducing the average response time by six minutes is worth approximately $10,000 per qualifying incident.
The same mathematics applies whether the improvement comes from better procedures, staffing, maintenance processes, automation, or technology.
Industrial alarm management platforms, such as those offered by SeQent, address the manufacturing downtime problem directly: they ingest alarms from SCADA and PLC systems, route them to the right person on the right device, and escalate automatically if no one responds. The economic logic is the same regardless of the specific platform. The relevant question is: How much does the intervention cost, and what is the resulting reduction in economically consequential downtime?
That is a finance question.
The cash-flow characteristics matter
An earnings improvement is more valuable when it does not require proportionate incremental capital. This is one reason improved manufacturing availability can be economically attractive.
If additional production can be generated from existing machinery, facilities, and infrastructure, the company may avoid some of the capital expenditure that would otherwise be required to create that capacity.
That can result in higher incremental ROIC, improved fixed-cost absorption, stronger free-cash-flow conversion, and potentially a lower capital intensity per unit of output.
The quality of the incremental earnings therefore matters as much as the amount. A $50 million operating improvement requiring $500 million of incremental capital has very different economics from a $50 million improvement requiring $10 million.
Investors should evaluate downtime initiatives on exactly that basis.
The caveat: not every minute of downtime has economic value
Any serious analysis needs to acknowledge an important limitation. A minute of downtime does not necessarily equal a minute of lost revenue.
If a plant has substantial unused capacity, missed production may simply be recovered later. Inventory can absorb temporary interruptions. Another facility may produce the units instead. Some downtime may be planned or economically unavoidable. And some equipment may not sit on the production constraint.
The value of availability therefore rises considerably under certain conditions:
- Demand is strong;
- Capacity is constrained;
- The affected asset is on the production bottleneck;
- Lost production cannot easily be recovered;
- Contribution margins are high;
- Failures result in scrap or lost batches;
- Service levels are affected;
- Replacement capacity is expensive.
This is precisely why the Lilly example is useful. When a company is committing billions of dollars to additional manufacturing capacity because of anticipated demand, the economic value of improving output from the installed base warrants examination.
That does not mean every minute of downtime at Lilly has a financial cost. It means the shadow price of available capacity is likely higher when additional capacity requires billions of dollars of investment.
Why investors have difficulty underwriting it
The biggest obstacle is data.
Most public companies do not disclose:
- Total hours of unplanned downtime;
- Estimated contribution margin lost to downtime;
- Economically recoverable downtime;
- Production interruptions by facility;
- Mean time from critical event to acknowledgment;
- Mean time from acknowledgment to intervention;
- Incremental investment required to improve availability;
- The return achieved on reliability investments.
As a result, investors cannot readily distinguish between a manufacturer operating near the practical efficiency of its installed base and one carrying significant recoverable operating inefficiency.
The problem may exist internally as well. A multinational manufacturer can operate dozens or hundreds of facilities using different machinery, control systems, processes, and definitions of downtime.
An individual plant may understand its availability statistics extremely well while corporate finance lacks a normalized view across the network. For an investor, that creates an information gap.
What would make this an investable signal?
Downtime itself is not necessarily an investment thesis.
The more interesting setup is a company exhibiting several characteristics simultaneously:
- Strong demand. Additional production can be sold.
- Capacity constraints. Management is investing materially to increase production.
- High incremental margins. Recovered output creates meaningful operating profit.
- Large existing manufacturing asset base. Small improvements can scale across many facilities.
- Elevated capital intensity. Adding conventional capacity is expensive.
- Evidence of operational improvement opportunities. Management is discussing reliability, productivity, utilization, or manufacturing execution.
- Low incremental capital requirements for improvement. Existing capacity can potentially produce more without proportionate physical expansion.
When those conditions exist, availability can become a source of positive earnings revisions, higher incremental ROIC, and stronger free-cash-flow conversion.
That is when the metric becomes relevant to an equity investor.
Investors should ask different questions
For asset-intensive businesses, several questions would be useful additions to traditional operating diligence:
- What is total unplanned downtime across the manufacturing network?
- What is the estimated economic cost rather than simply the number of hours?
- What portion of that downtime occurs on capacity-constrained assets?
- What portion is realistically recoverable?
- How has mean time to acknowledge and mean time to repair changed?
- How much capital is being invested to increase availability of the installed asset base?
- What incremental ROIC has the company achieved on those investments?
- How does the return compare with adding new physical capacity?
Those questions are more financially useful than asking whether a company has an “Industry 4.0 strategy.” They connect operational performance directly to earnings and capital allocation.
Model economically recoverable downtime, not gross downtime
There is a clear risk of overstating the opportunity. Any credible financial analysis should therefore move from reported downtime to economically recoverable downtime.
One way to think about it is:
Total unplanned downtime
- Less downtime with no material economic consequence
- Less unavoidable downtime
- Less production recoverable through existing excess capacity
- Less downtime that cannot economically be remediated
All adds up to equal economically addressable downtime.
From there, economically addressable production multiplied by incremental contribution margin gives an estimate of potential operating profit. Then subtract the capital and ongoing operating costs required to capture it.
That produces a number a CFO can actually underwrite.
The equity-research implication
Ultimately, the relevance for an investor is not downtime itself. It is whether changes in manufacturing availability can cause actual earnings to differ from the earnings currently embedded in consensus estimates.
If a capacity-constrained manufacturer increases output without proportionate increases in labor, overhead, or capital, the improvement can appear through several financial lines:
- Higher volume.
- Better gross-margin absorption.
- Higher operating margins.
- Improved incremental ROIC.
- Higher free cash flow.
- Positive earnings revisions.
That is where an operational metric becomes an equity-research variable.
Return to the hypothetical $50 billion manufacturer.
At a 40% contribution margin and 15x multiple, approximately 33 basis points of incremental economic output supports $1 billion of incremental enterprise value.
For Lilly, using an illustrative 60% contribution margin and 20x earnings multiple, the corresponding threshold is approximately 13 basis points.
Whether any specific company can recover those basis points is an empirical question. But when public companies are spending billions of dollars to build additional manufacturing capacity, investors should at least calculate what equivalent capacity could be created by increasing the availability of assets already installed.
The framework is straightforward:
- What is the annual economic cost of unplanned downtime?
- What portion is realistically recoverable?
- What investment is required to recover it?
- What is the incremental ROIC relative to adding new capacity?
- If management can answer those questions, downtime belongs in the earnings model.
- If it cannot, investors may be missing a variable that is financially material precisely because it has historically been treated as operational.
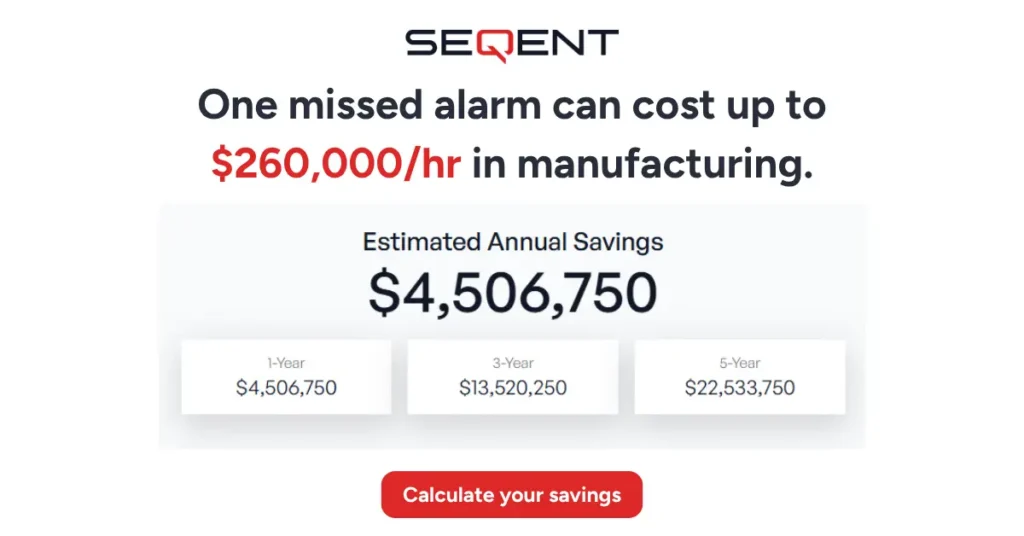
For manufacturers looking to quantify the financial case for improving alarm response, SeQent’s ROI Calculator provides a starting framework for estimating the value of reduced response time against a specific production environment.
Sources
- [1] Eli Lilly and Company, 2025 Form 10-K (revenue, cost of sales, capital expenditures, and manufacturing expansion commentary). SEC filing
- [2] Eli Lilly and Company, May 2026 announcement of $4.5 billion in additional Indiana manufacturing investments. Lilly investor relations
About SeQent
SeQent is an industrial automation software company that keeps critical operations running. Its Industrial Alarm and Events Platform unifies alarm and event data from SCADA, MES, PLC, and plant systems, then routes it into immediate, confirmed action across radios, smartphones, Andon displays, PA systems, and pagers. SeQent operates in more than 500 sites worldwide and has delivered over a billion critical notifications for Fortune 500 manufacturers in automotive, semiconductor, pharmaceuticals, food and beverage, energy, and consumer goods.
The detection-to-response gap described in this article is the problem SeQent was built to close. To learn more about how manufacturing downtime occurs, what it costs, and how faster alarm response reduces it, visit seqent.com/manufacturing-downtime.